
F&I PVR and product penetration: the numbers your GM watches
How to calculate the two numbers that decide most F&I pay plans, what the 2026 averages look like, and how to improve them the right way.
Camila VenegasUpdated November 20265 min read
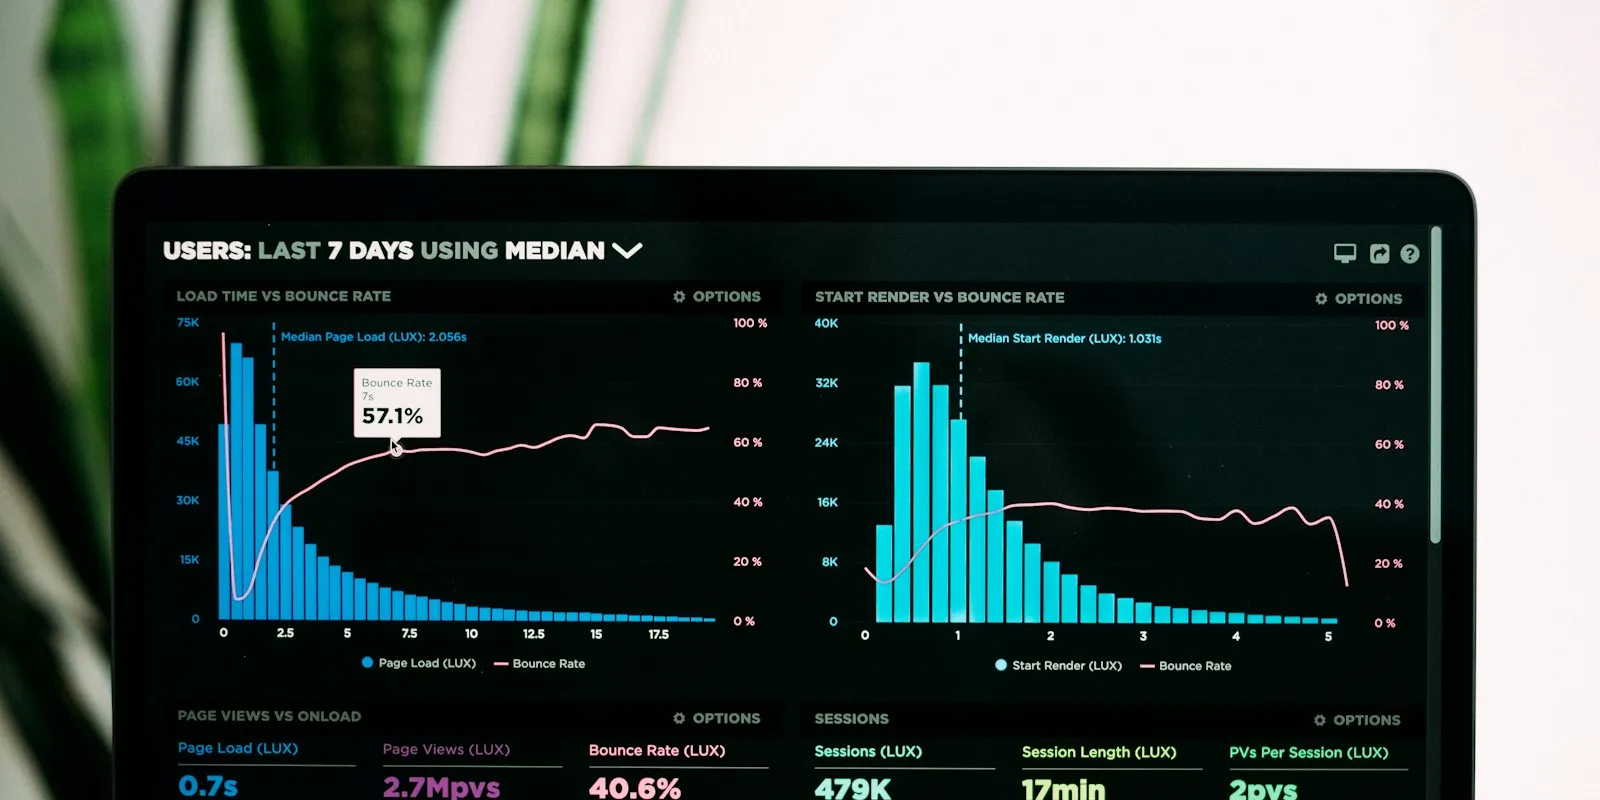
PVR (per vehicle retailed) is total F&I income divided by the number of retail deals. Product penetration is the share of deals that include a given product, like a service contract or GAP. Together they show how productive an F&I office is. StoneEagleDATA reported an average F&I PVR of $1,986 in Q1 2026, but your store’s numbers depend on brand, customers and products.
Why these two numbers matter to you
Your GM won’t ask how your day went. They’ll ask about your PVR and your penetration. Most F&I pay plans are built on them too. See F&I pay plans explained.
In my 17 years in the car business, the managers who understood these numbers knew exactly what to improve, instead of just “selling harder.”
What is F&I PVR?
PVR = total F&I income ÷ number of retail deals. Example: $180,000 ÷ 100 deals = $1,800 PVR.
F&I income usually includes finance reserve from lenders plus profit on products. Some stores calculate PVR on retail deals only, others include all deals. Ask how your store does it.
What is product penetration?

Penetration = deals with the product ÷ total deals. Example: 45 service contracts on 100 deals = 45% penetration.
Stores track penetration for each product: service contracts, GAP, maintenance plans, appearance protection and others. A related number is products per deal, the average number of products sold per retail deal.
What do 2026 benchmarks look like?
StoneEagleDATA reported an average F&I PVR of $1,986 in Q1 2026, with an average of 1.57 products per deal. Other benchmarks use different methods: the Presidio-NCM report put average F&I income per retail unit at $1,727 for the same quarter, as reported by WardsAuto.
Use these as context, not targets. Luxury, domestic, used-only and high-volume stores all look different. Compare yourself to your own store’s averages first.
How do you improve PVR and penetration honestly?
- Present a menu on every deal. Penetration drops when customers never see the options. See the F&I menu, explained.
- Interview before you present. Ask how long they’ll keep the car and how far they drive.
- Know your products. Clear explanations sell better than pressure. Start with GAP and service contracts.
- Handle objections well. Read how to handle F&I objections honestly.
- Keep rates fair and consistent. Read buy rate vs. sell rate.
What should you never do to hit the numbers?
- Pack products into a payment without the customer’s clear choice
- Tell a customer a product is required for approval
- Mark up rates inconsistently from one customer to the next
- Ignore cancellations: high PVR with high chargebacks isn’t real income
Numbers built on pressure come back as cancellations and complaints. Read F&I compliance basics.
Frequently asked questions
What is a good F&I PVR?
It depends on the store, brand and market. Industry averages in 2026 were near $2,000 per StoneEagleDATA, but compare yourself to your own store first.
Does PVR include finance reserve?
Usually, yes. PVR typically includes reserve plus product profit. Ask how your store calculates it.
What is a good service contract penetration?
It varies widely by store and customer mix. Track your own trend over time.
How are PVR and penetration tied to pay?
Many F&I pay plans pay a percentage of F&I income and add bonuses for PVR or penetration tiers.